How to Harness U.S. Census Data to Masterfully Organize Your Food Brand’s Sales Across America

Introduction
The U.S. food market is a labyrinth of opportunities and challenges. To navigate it successfully, you need more than just a great product—you need data-driven insights. U.S. Census data offers a wealth of information that can help you organize your sales efforts with precision. This guide will provide you with a comprehensive framework, breaking down the U.S. market into regions, divisions, and states, to help you tailor your sales strategies effectively.
Why Census Data is Your Secret Weapon
The U.S. Census Bureau collects a plethora of data that can be invaluable for food brands. From demographics to economic indicators, this data can serve as the backbone of your sales and marketing strategy, helping you identify lucrative markets and consumer trends.
Organizing Your USA Geography Sales Market Area
USA Regions and Divisions
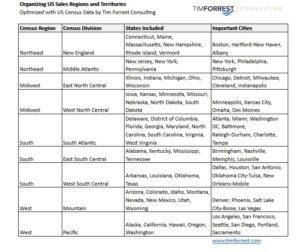
Consumer Product and Food Companies often segment the U.S. market into two sets of sub-national areas: 9 census divisions nested within 4 census regions. Here’s a detailed breakdown:
The Northeast Region
- New England Division: Connecticut, Maine, Massachusetts, New Hampshire, Rhode Island, Vermont
- Middle Atlantic Division: New Jersey, New York, Pennsylvania
The Midwest Region
- East North Central Division: Illinois, Indiana, Michigan, Ohio, Wisconsin
- West North Central Division: Iowa, Kansas, Minnesota, Missouri, Nebraska, North Dakota, South Dakota
The South Region
- South Atlantic Division: Delaware, District of Columbia, Florida, Georgia, Maryland, North Carolina, South Carolina, Virginia, West Virginia
- East South Central Division: Alabama, Kentucky, Mississippi, Tennessee
- West South Central Division: Arkansas, Louisiana, Oklahoma, Texas
The West Region
- Mountain Division: Arizona, Colorado, Idaho, Montana, Nevada, New Mexico, Utah, Wyoming
- Pacific Division: Alaska, California, Hawaii, Oregon, Washington
Important Nielsen Metropolitan Areas within Regions
These metropolitan areas are key markets that can be the focus of your targeted sales strategy:
- Albany, Atlanta, Baltimore, Birmingham, Boston, Buffalo/Rochester, Charlotte, Chicago, Cincinnati, Cleveland, Columbus, Dallas, Denver, Des Moines, Detroit, Grand Rapids, Hartford-New Haven, Houston, Indianapolis, Jacksonville, Kansas City, Las Vegas, Little Rock, Los Angeles, Louisville, Memphis, Miami, Milwaukee, Minneapolis, Nashville, New Orleans-Mobile, New York, Oklahoma City-Tulsa, Omaha, Orlando, Philadelphia, Phoenix, Pittsburgh, Portland, Raleigh-Durham, Richmond-Norfolk, Sacramento, Salt Lake City-Boise, San Antonio, San Diego, San Francisco, Seattle, St Louis, Syracuse, Tampa, Washington DC, West Texas
We’ve taken the Census regions, divisions, states, and important markets and organized them into a document for your use and download. LINK
LINK TO EXCEL SPREADSHEET OF CENSUS AREAS
How to Utilize This Data for Sales Optimization
- Sales Regions and Divisions: Utilize Census structure for designing your sales territories and region organization. Nest the states within this structure for better organization and alignment with market efforts.
- Demographic Targeting: Use Census data to identify key demographics that align with your product offerings.
- Geographic Focus: Utilize the regional and divisional breakdown to prioritize your sales efforts.
- Economic Indicators: Leverage economic data to inform your pricing and promotional strategies.
- Competitive Analysis: Use the geographic data as a starting point for a more in-depth competitive analysis.
- Trend Analysis: Keep an eye on Census reports to adapt to emerging consumer behaviors and preferences. Also, compare per capita consumption within regions, states, and divisions to better understand effectiveness.
Conclusion
The U.S. Census data is not just a collection of numbers; it’s a strategic tool that can help you understand the American consumer in unparalleled depth. By leveraging this data, you can craft a sales strategy that is not only effective but also innovative, setting your food brand apart in a crowded marketplace.
Take Action Now!
Ready to transform your food brand with data-driven insights? Book a consultation at www.timforrestmarkets.com to leverage U.S. Census data for unparalleled market insights.
 “Hi I’m Tim, and I love the food business! I’ve been helping large and small companies and entrepreneurs achieve success for decades. My consulting projects have contributed to major successes for my clients, including many with 100%+ year-over-year growth rates. I enjoy sharing my expertise, and hope you find these blog posts enlightening. Please reach out to me with any questions or comments.”

Share This Story
Related Posts

Cracking the Costco Code: 3 Game-Changing Tips from a Food Industry Guru
Are you a food entrepreneur dreaming of seeing your product on Costco’s shelves? Getting into this retail giant can be a game-changer for your brand, but it’s no easy feat. Fortunately, industry expert Tim Forrest has shared invaluable insights in his recent YouTube video that can help you make your pitch more appealing to Costco […]

11 Game-Changing Strategies to Disrupt Your Food Category and Dominate the Market
In today’s fiercely competitive food industry, standing out is no longer just an option – it’s a necessity. Category disruption has become the secret weapon for brands looking to make their mark and capture market share. At Tim Forrest Consulting, we’ve helped countless food brands revolutionize their categories and achieve remarkable success. Today, we’re sharing […]

From Local Star to USA Market: How One Entrepreneur’s Journey Can Transform Your Food Business
The journey from local success to international stardom is a path many food and beverage entrepreneurs dream of treading. But what does it really take to make that leap, especially when targeting the competitive U.S. market? Mark Watkins, owner of Drank Drops, recently shared his inspiring story of transformation and growth, offering valuable lessons for […]

Mastering Costco’s Pallet Game: Boost Your Sales with Expert Display Strategies
Are you looking to take your product sales at Costco to the next level? As a seasoned food industry consultant, I’ve helped numerous brands maximize their presence and profitability in this retail giant. Today, I’m sharing my insider knowledge on how to leverage pallet displays effectively to capture shoppers’ attention and drive sales. Costco’s Pallet […]

Billion-Dollar Secret: The MMA-SVQ Framework That’s Transforming Food Brands
Are you ready to take your food business to the next level? Tim Forrest, a renowned food strategy consultant with a track record of generating over $1 billion in client growth, has unveiled his game-changing MMA-SVQ framework. This powerful approach has been the secret behind numerous success stories in the food industry, and now it’s […]

Mastering Food Marketing with Timeless Strategies
In the competitive world of food marketing, standing out from the crowd is more challenging than ever. But what if the key to success has been hiding in plain sight for over a century? Enter Claude Hopkins’ “Scientific Advertising,” a groundbreaking and foundational book that continues to shape modern marketing strategies. Our recent deep dive […]

Mastering the Art of Selling to Costco Wholesale: Your Comprehensive Guide
Are you ready to take your food product to the next level and get it onto Costco’s shelves? As a seasoned food industry consultant with over 35 years of experience, I’ve helped numerous clients navigate the complex world of selling to Costco Wholesale. In this comprehensive guide, I’ll share my insider knowledge and proven strategies […]

Unlocking Club Store Success: A Deep Dive into Warehouse Retail Dynamics
The world of warehouse clubs like Costco, Sam’s Club, and BJ’s presents unique opportunities and challenges for food brands. In my video “Club Store Food Success with Tim Forrest,” I share insights from decades of experience in this specialized retail sector. Here are the key points to understand: The Warehouse Club Model Warehouse clubs operate […]

Let’s Talk

")


What We Do
 We help food entrepreneurs and established companies get their products onto shelves and into the hands of consumers. Through personalized collaboration, you’ll learn to succeed using a proven path of marketing, sales, merchandising, distribution and business growth strategies. We’ve generated over $1 billion in revenue and company valuations for our clients. Let us put our expertise to work for you.


